Last week, the American Diabetes Association (ADA) released their audited financial statements for 2018. This is the seventh year that we have reviewed these financial documents and little has changed. The ADA remains one of the largest and most powerful diabetes organizations in the world, but the organization almost exclusively dedicates its resources to type two diabetes and spends very little on type one.
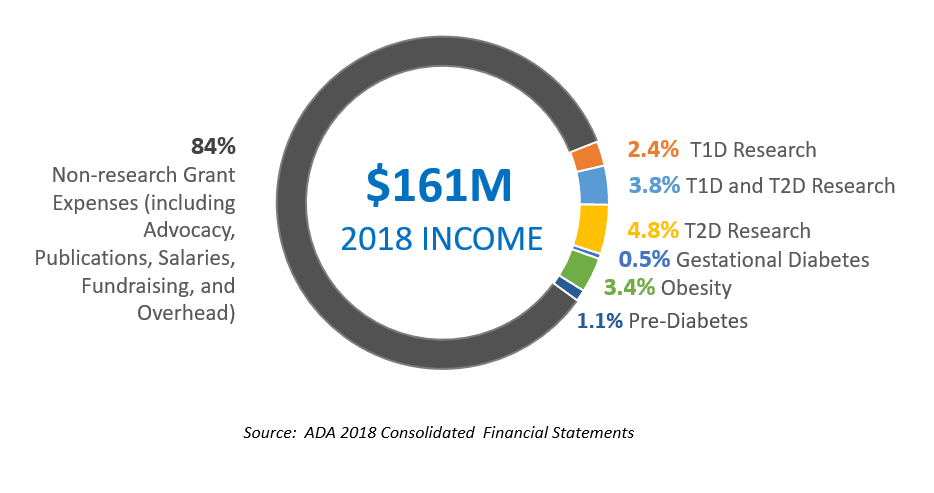
The organization's success is built upon a fundraising apparatus of walks, rides, and galas held in cities throughout the United States. Many of these events feature advertising of children and none specify whether the money will be used to support T2D or T1D. In actual fact, as illustrated in the opening image, only 2.4% of the ADA's funds are used for dedicated T1D research. Said differently, for every dollar given to the ADA, only $0.024 is used for T1D research and $0.038 cents is used for T1/T2 combined base research— the other $0.93 is used exclusively for T2D.
In comparison, JDRF is singularly focused on T1D, which makes it a superior philanthropy choice for most of our readers. Giving to JDRF eliminates the risk that your donation will be used for type 2 diabetes.
Summary Points:
- The ADA's 2018 Annual income was $161m, up from $150m in 2017.
- Only 16% of the ADA's annual income was used for funding research, down from 24% in 2017. 84% was used for non-research activities, including education, advocacy, salary, and overhead.
- Only 2.4% of the ADA's annual income was spent on research specifically focused on T1D. See opening image.
- 85% of the ADA's research spending budget was dedicated entirely to T2D in 2018.
- Despite the ADA's focus on T2D, fundraising materials continue to target the T1D community and utilize images of children.
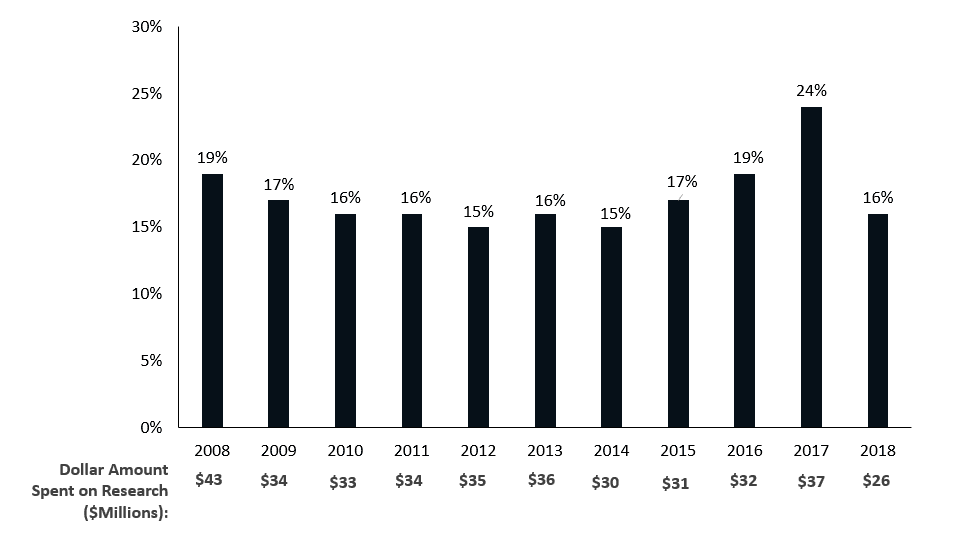
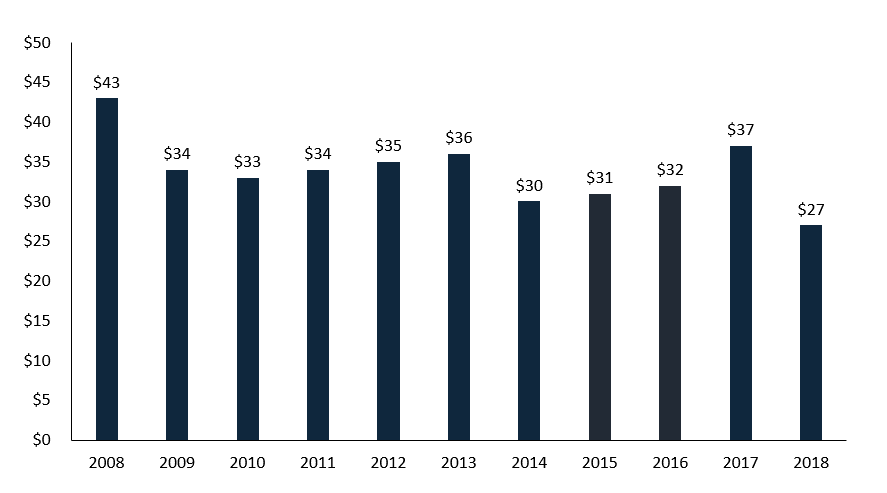
- Ten-year trends in research funding by the ADA highlight a decreased focus on research funding. "Appendix A" shows the absolute amount spent on research grants over time. "Appendix B" shows the percent of income used for research grants.
All financial data is contained in the ADA's publicly available financial documents: Click here to view.
Appendix A: ADA Total Annual Spending on Research Grants ($ millions)
Appendix B: Percent of Annual Income Spent on Research (All Types) by Year