
June 22, 2023
This report takes a look at how the American Diabetes Association (ADA) raised and used its money in 2022. The ADA utilizes a calendar year for its fiscal reporting. The source of the numbers used in this report are the ADA's own Audited Financial Statements (see endnote 1). All opinions stated in this report are that of the JDCA.
2022 is the first year after COVID. As such, we would expect that income and expense performance would have returned to the pre-COVID years of 2019 and earlier. We will use 2019 as a near-term historical benchmark and 2006 as a long-term benchmark to gauge how the organization has changed over time.
This is also the first full half-year after the new CEO, Charles Henderson, took the reins last May. Much was anticipated of Mr. Henderson when he took the role. Board Chair at the time, Christopher Ralston, said that he believed Henderson would “catapult the ADA into the future" (see endnote 2).
However, 2022 numbers suggest that the catapult has yet to be loaded. Revenue is at an all-time low and research grants remain behind historical benchmarks.
ADA Revenue
Revenue is the key story in 2022. Revenue declined to the lowest level of the past 17 years (the full duration of the period that we have been tracking the ADA). In 2006, revenue totaled $214 million. In 2022, revenue came in at $113 million, cut nearly by half (see chart 1). Revenue has also declined versus 2019 by about 1/3, when it was $156 million.
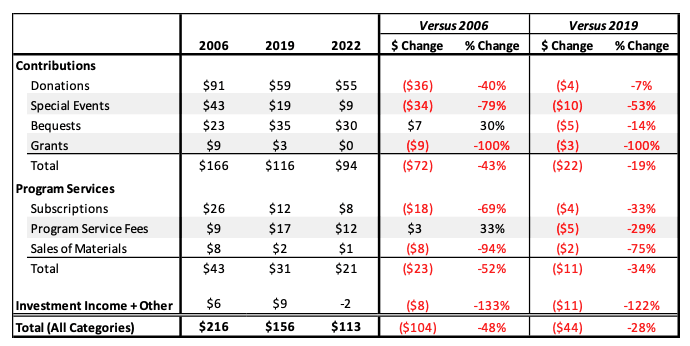
What has changed in these years? From a financial standpoint, the main drivers of the revenue decline are a $36 million decrease in corporate and individual contributions; and a $34 million decrease in revenue from special events like walks, rides, and galas (see chart 2). The change did not happen overnight as revenue has been on a slow slide downward since 2012.
When any organization sees its revenue decline by this magnitude over time it raises existential questions. Is the value proposition less relevant than twenty years ago? Will the downward trend continue? What is being done to change the course and is it enough? We do not know the answers. Over the years the JDCA raised these topics to ADA executives, on behalf of the T1D community. To date, these questions remain unaddressed.
Chart 1: ADA Revenue (in millions), 2006-2022
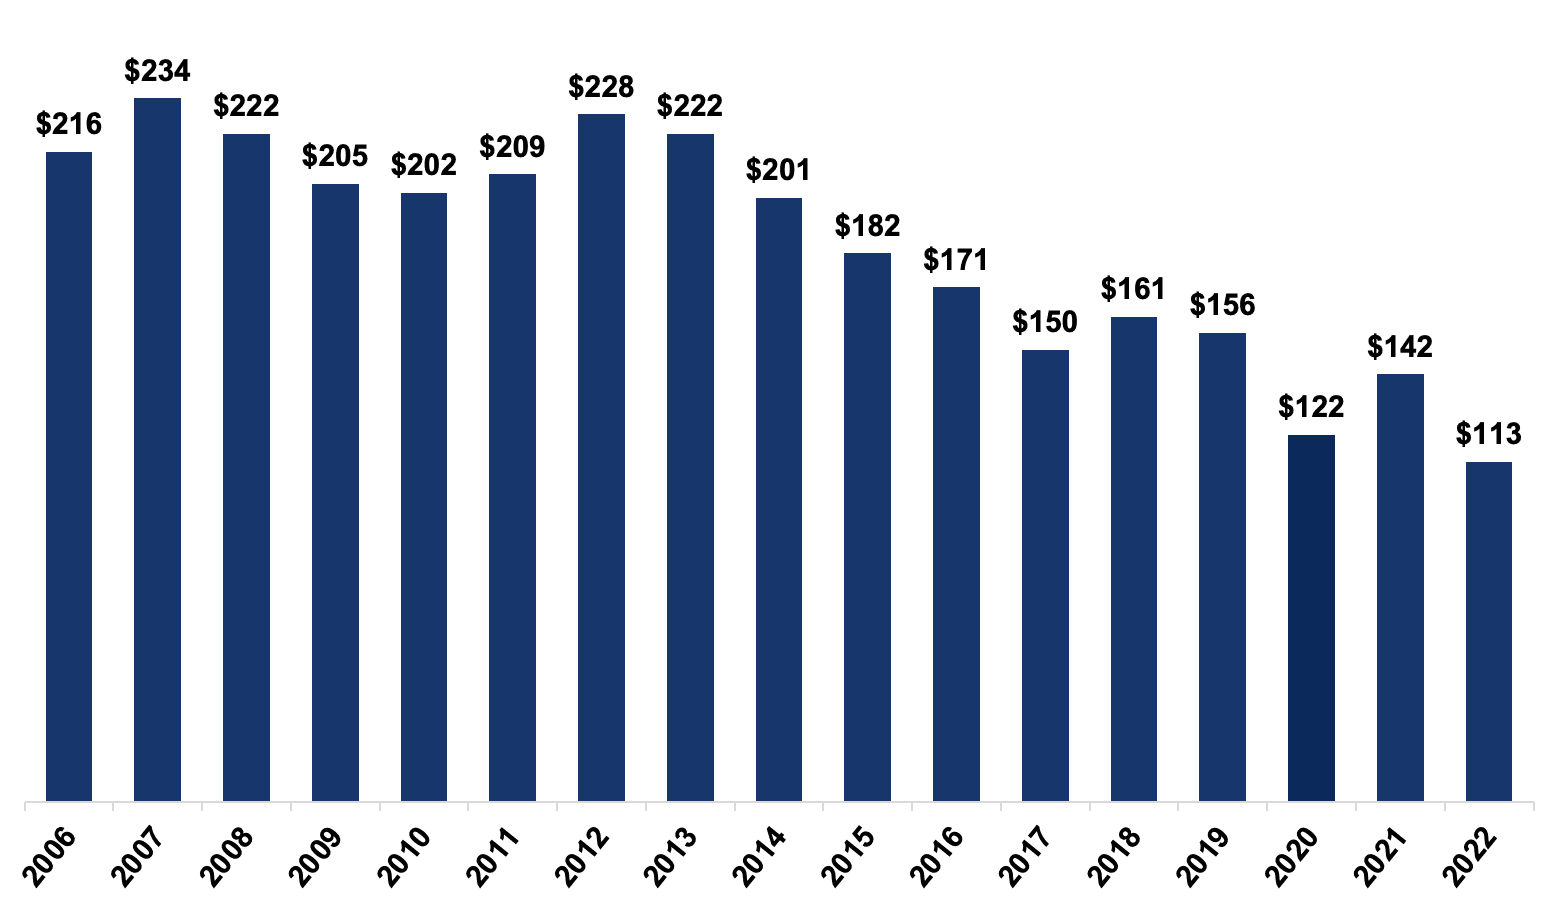
Chart 2: ADA Revenue Sources vs. 2006 and 2019 Benchmarks ($ Millions)
ADA Expenses
The ADA responded to COVID by dramatically cutting its operating budget and has maintained that posture in 2022. Unlike JDRF, which has been restoring its program activities after COVID, the ADA’s programmatic rebuilding is being limited by its reduced revenue (see chart 3).
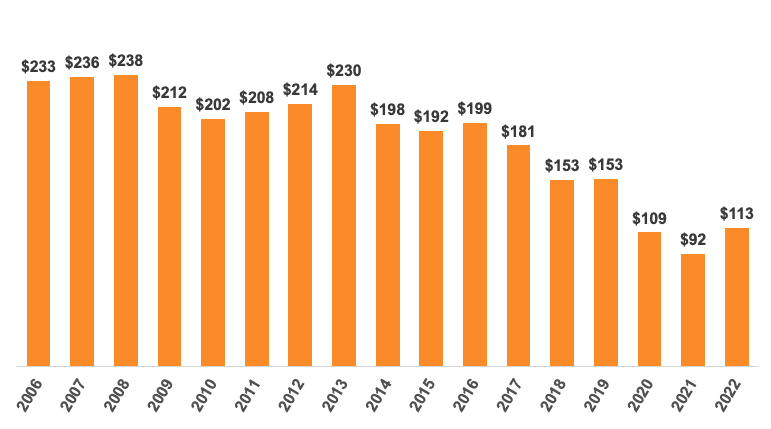
2022 total expenses were $113 million, less than half of 2006 and -26% less than 2019. Two potential explanations for the change are that the ADA is operating with remarkable efficiency compared to prior years or it is doing less.
Chart 3: ADA Total Expenses (in Millions), 2006-2022
Every expense category was cut compared to both the long-term and the near-term benchmark years. Delivery of diabetes information to the community, which is the largest expense category and the primary output of the ADA, reduced by -35% from 2006 and by -5% versus 2019.
This is an area where the ADA really shines. Its annual research conference on diabetes is one of the most important in the world and the publications and papers it provides carry great impact.
Research grants, the second largest spending category, declined by -54% compared to 2006 and by -18% versus 2019 (see chart 4). During the same time frame, research grants became more expensive to distribute. The internal costs associated with allocating each single dollar of research grants have doubled since 2006. These internal costs include meetings, salaries, administration, and other activities undertaken by the ADA to disperse grants.
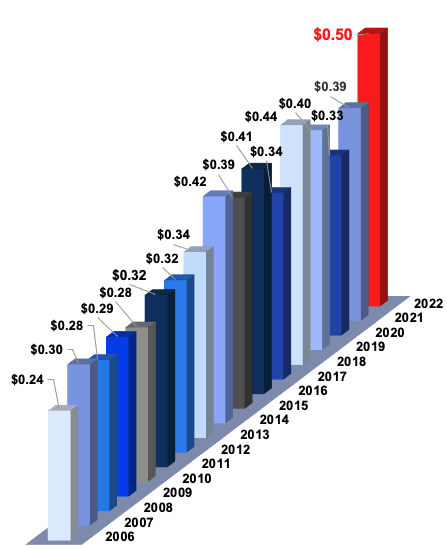
In 2006, it cost the ADA $0.24 cents to distribute each dollar of research grants. In 2022, it rose to $0.50 per dollar of research grants (see chart 5). While the specific drivers of this efficiency decline are unclear to us, it does appear that the ADA has not reduced the heft of its internal grant-giving apparatus to align with reduced financial support.
Chart 4: 2022 Expenses vs. 2006 and 2019 Benchmarks (in Millions)
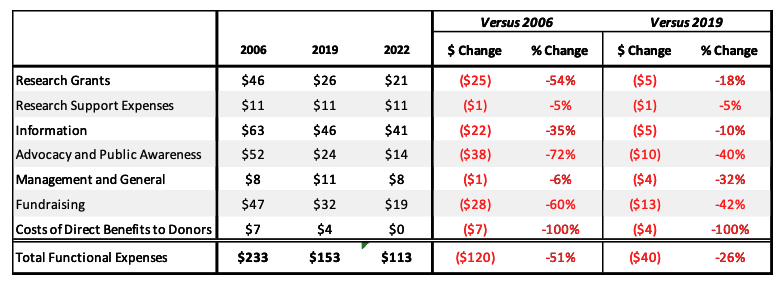
Chart 5: The Internal Costs Associated with Giving Out Each Dollar of Research Grants By Year
Conclusions
2022 results confirm that the ADA continues to face significant challenges to its historic business model and value proposition. The strategic questions laid out earlier in this report must be answered and we very much hope they are being taken seriously. A strong ADA is good for the T1D community.
Based on our surveys of the type 1 diabetes donor community, introducing a Functional/Practical Cure-focused initiative could change the fate of the ADA as well as the direction of diabetes research funding. This would be very attractive to T1D financial donors.
Endnote Links:
1: ADA Consolidated Financial Statements Year Ended December 31, 2022
2: ADA Names Charles D. Henderson as New Chief Executive Officer