
At a Glance
- Revenue reached $145 million, recovering somewhat since COVID.
- However, revenue remained well below the $200 million+ of the early 2000s, raising the question of brand value and relevance.
- Total expenses increased +11% from last year. The biggest expenses by far were management and general (salaries, benefits, other administrative costs, etc.)1 which ballooned +47% (a gain of +$4 million).
- Research grants were held flat from FY22 at $22 million even as revenue increased. As a result, the relative importance of research grants decreased from the prior year, from 19% to 15% of revenue.
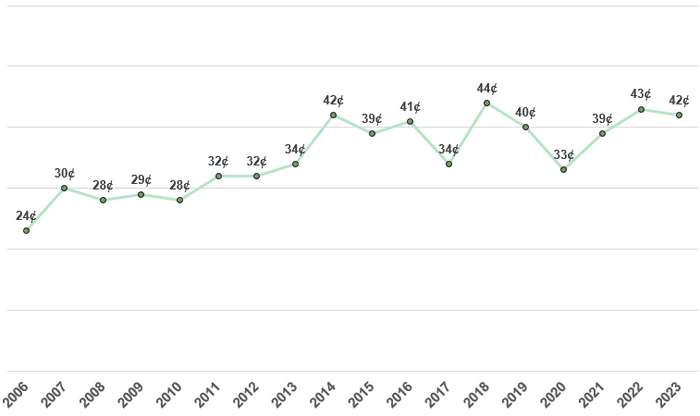
- It cost $0.42 to give away each $1 of research grants, among the highest in the past 20 years and nearly double the 2006 low benchmark of $0.24.
July 2, 2024
A few weeks ago, the American Diabetes Association (ADA) released its Fiscal Year 2023 (FY23) financial statements, covering the period from January 1, 2023, to December 31, 2023. This report will look at how one of the nation’s largest diabetes nonprofits raised and directed its money in the past year. The ADA’s publicly available FY23 Consolidated Financial Statements and prior statements are the sources for this report. All opinions held within are based on JDCA analysis.
Revenue: Up from Prior Year but Still Way below the Early 2000s
Versus Prior Year and COVID Years
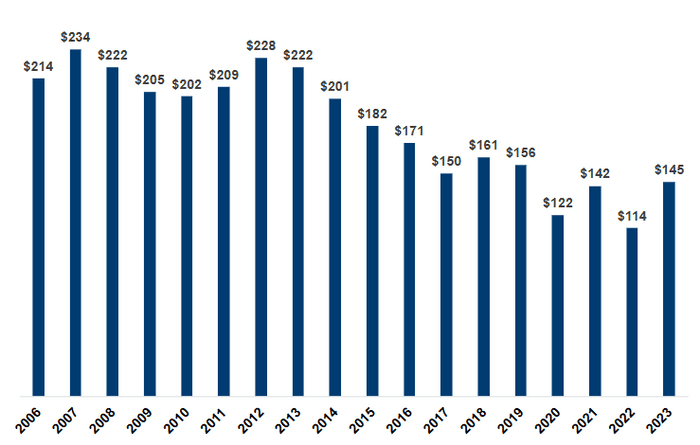
FY23 revenue increased +28% compared to the prior year, to $145 million (see chart 1). The largest contributor was money collected from donations, accounting for 43% of total revenue, and grew +$6 million from the prior year. The main drivers of revenue growth were gains from investments (+$14 million), following a year of negative returns, and a material gain in bequests (+$9 million).
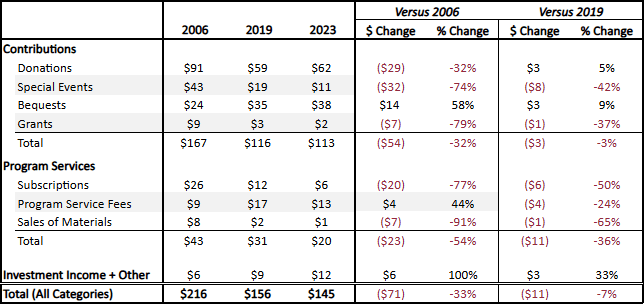
It is worth noting the comparatively low contribution of special events such as walks, rides, and galas, that the grassroots community implements on behalf of the organization. In FY23, special events contributed only 7% of total income, down from 29% a decade ago. In 2015, the community special events raised $48 million, while in 2023 they raised $10 million. The question to ask here is ‘why?’ – why did the grassroots community substantially decrease its efforts for the ADA?
Chart 1: ADA Revenue ($ Millions), 2006-2023
Versus the Early 2000s
FY23 revenue was far lower than in the ten years between 2006 and 2016, the earliest years for which we have data. From 2006 to 2014, the reported total revenue for the ADA in each year was always above $200 million, not adjusted for inflation (see chart 2). Since then, revenue did not recover and instead declined further, dropping to $156 million in 2019, the year before COVID, and bottoming out in 2023 at $114 million.
In 2006, the ADA raised a reported $214 million compared to $145 million in 2023. When adjusted for inflation to reflect the true buying power, the dollar-to-dollar comparison is $323 million in 2006 versus $145M in 2023, a -55% decline from the golden days of the ADA. During this same period, special event contributions declined -75%—as discussed in the prior section—a main contributor to the revenue drop.
Such a drop in revenue and contributions from related grassroots community fundraising events raises the question about the ongoing value and relevance of the ADA brand. When the ADA was the primary source of information and knowledge about diabetes, its relevance was clear to the community. Today, there are many others in the field, and that appears to be taking its toll on revenue. Its annual research conference and guidelines for professionals continue to deliver tremendous value, but it may not be delivering enough benefit to return to its golden fundraising years.
In addition, the ADA is less relevant to the T1D fundraising community than it was in the past. JDCA’s proprietary surveys conducted during the past two years found that the T1D community holds a favorable opinion of the ADA as an organization (53% positive), but only a minority (11%) choose the ADA when donating to a diabetes-focused charity. This gap is a real opportunity for the ADA to grow revenue, as 88% said they would give to the ADA if it devoted more resources to driving forward T1D cure research.
Chart 2: ADA Revenue Sources vs. 2006 and 2019 Benchmarks
Expenses: Salaries Up; Research Grants Stagnant
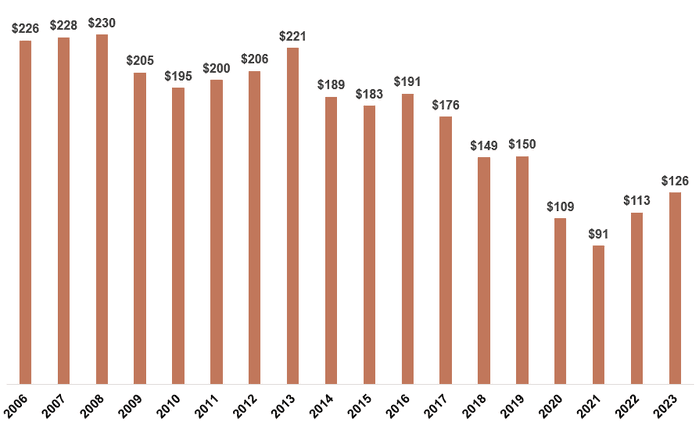
Although the ADA had substantially lower expenses in FY23 than in the pre-COVID years, the number is rising, with the biggest percentage gains in salaries, payroll, management and general costs. In FY23, the ADA total expenses increased by +11% versus FY22, to $126 million, compared to $150 million in 2019 (see chart 3).
Chart 3: ADA Total Expenses ($ Millions), 2006-2023
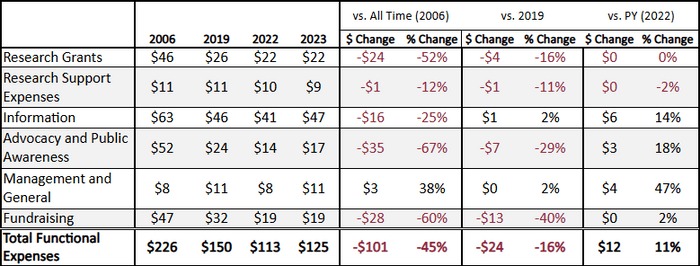
Information delivery remains the ADA’s largest spending area, and in FY23 it accounted for 38% ($47 million) of all spending, growing 14% ($6 million) from the prior year. It has consistently been the largest area during the nearly two decades we have been tracking ADA expenses.
The fastest-growing expense category is management and general, which primarily reflects salaries, benefits, and other administrative costs. This expense category grew +47% from the prior year. At $11 million in FY23, it has returned to pre-COVID levels. While the overall expenses are lower than pre-COVID, management and general have been fully replenished. The savings versus pre-COVID stem from other expense areas. Compared to 2018, only two categories have increased expenses: management and general is up 23% and information is up 5%. All other categories are down, including advocacy, awareness, and fundraising.
At the same time, research grants remained stagnant versus FY22 and continue to be materially lower than 2006-2017. During these years, research grants were annually greater than $30 million (exception: 2014 at $29 million), not adjusted for inflation. In FY23, research grants were $22 million, the same as the prior year. Research grants are -52% lower compared to 2006 and -17% lower compared to 2019 (see chart 4).
Chart 4: 2023 Expenses vs. 2006 and 2019 Benchmarks ($ Millions)
Furthermore, the internal costs associated with allocating each dollar of research grants have almost doubled since 2006 (see chart 5). In 2023, it cost the ADA 42¢ to allocate one research dollar, compared to 24¢ in 2006.
Chart 5: Internal Costs Associated with Giving Each Dollar of Research Grants (Year)
Conclusions
The ADA finds itself at a crossroads. Revenue remains well below its golden years in the first decade of the century, raising questions of value and relevance. Since then, it has reinforced its position with the T2D community and largely undervalued the T1D community, one of the most effective fundraising entities for any disease. We believe this is reflected in the revenue decline.
We also believe that a strong ADA is good for diabetes and good for T1D. In a T1D community survey from February of this year, 88% said they would donate to the ADA if it prioritized a Practical Cure, and 98% want the ADA to introduce a Practical Cure initiative. There is a real opportunity for a win-win. Regaining the loyalty of the T1D community will grow ADA fundraising revenue. The T1D community is willing to revitalize donations if the ADA reaffirms a material commitment to a T1D Functional Cure. This opportunity is here for the taking—good for the T1D community and good for the ADA.
Endnote
1. “Other Presentation Matters: 958-720-45-7 (Management and General Activities),” Financial Accounting Standards Board, https://asc.fasb.org/1943274/2147477876. Financial Accounting Standards Board overview of what constitutes Management and General Activities.