
At a Glance
- Income recovers to $224M (up from $195M in FY22).
- Special event fundraising (e.g., walks and galas) are still about -30% lower than in pre-pandemic years.
- Total expenses have been consistent since 2008, but the mix has improved versus prior years.
- Research grant funding is at the highest level since 2013, following many years of decline, with $98 million in grants.
- A huge cash and short-term investment ‘war chest’ of $188 million is undeployed. This compares to $30 million pre-COVID.
June 18, 2024
2023 fiscal year (FY23) financial results1,2 for Breakthrough T1D (formerly JDRF), show a return to normal operations following the COVID years. The big news is that research grant funding is at its highest level since 2013 and is close to half of the organization’s revenue utilization, approaching a key benchmark JDCA has advocated for several years. This reverses the multi-year trend of declining research grant funding, and we hope it continues.
This review looks at the research grant funding levels as well as other main spending and income areas. All data used in the report, unless otherwise stated, is sourced from public financial records attached as endnotes. All dollar figures are nominal as reported and not adjusted for inflation.
Income: Recovers from the Prior Year
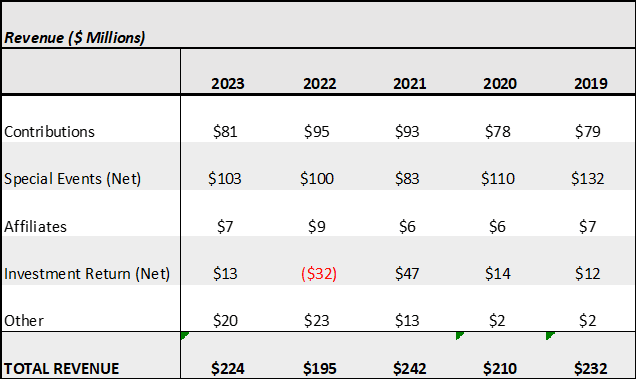
Total revenue, which combines both Breakthrough T1D and the T1D Fund, reached $224 million in FY23, an increase from FY22. This is down from the record $242 million collected in FY21 but consistent with years immediately before COVID, prior to 2020 (see chart 1).
The main factor driving revenue recovery from FY22 is a reversal from a loss on investment return income (-$32M) to a positive return in FY23 (+$13M), a gain of $45 million. The majority of this gain is driven by royalty income from Breakthrough T1D grants from previous years (royalty clauses are often part of standard grant agreements) and an $11 million gain from an exit transaction for the T1D Fund.
The final revenue highlight is that in-person fundraising events remain 30% below pre-pandemic levels. Special fundraising events raised $103 million in FY23, still well behind the $132 million in FY19. Breakthrough T1D executives noted that while these events are not expected to experience significant growth in the upcoming year, other fundraising avenues are being opened to fill and maintain income growth.
Chart 1: Breakthrough T1D Revenue Sources, FY 2019-2023
Spending: On the Rise but Better Mix
Overall, Breakthrough T1D FY23 expenses grew +$52 million compared to FY22 and are about the same level as the FY19 pre-COVID benchmark year (see chart 2). However, the mix of spending has improved since pre-COVID, with materially more dollars going to fund research grants, a directional move for which the JDCA has advocated for over a decade.
Chart 2: Breakthrough T1D Total Expenses, FY 2003-2023 (in Millions)
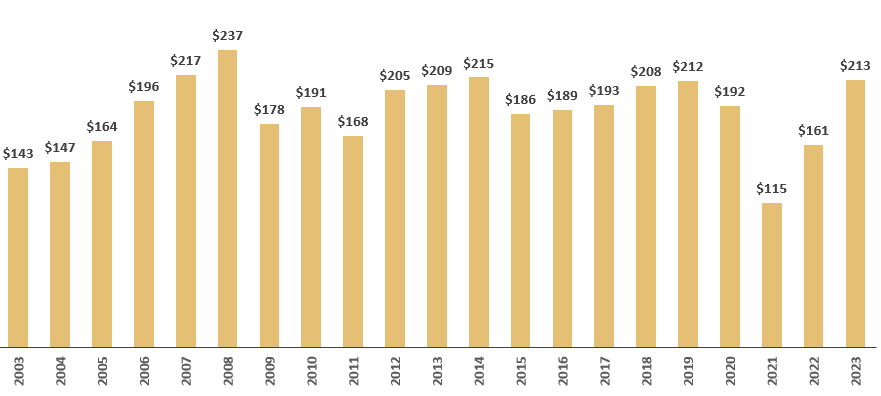
Nominal - not adjusted for inflation
Research Grants: A Return to Priority?
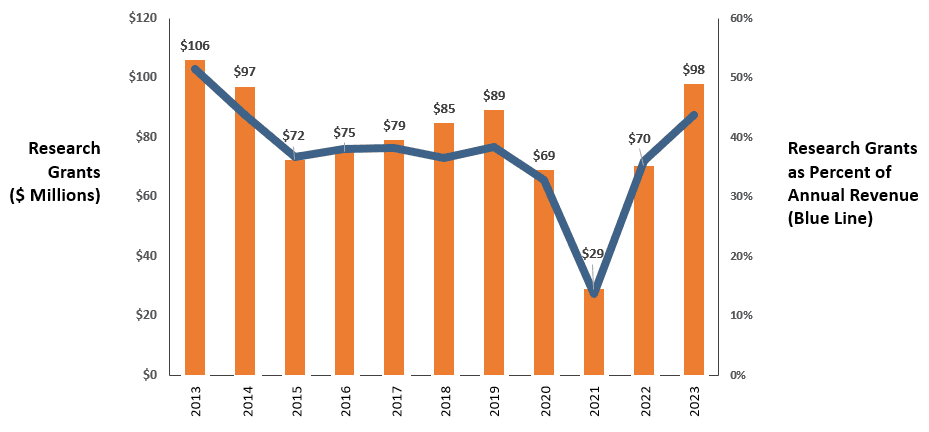
Research grants were the highest they have been in the past ten years, since 2013. In FY23, Breakthrough T1D spent $98 million on research grants, roughly 44% of its income. The last time it was this high was in 2013, when Breakthrough T1D spent $106 million to fund research grants, 51% of that year’s annual income (see chart 3).
Chart 3: Research Grant Trends, 2013-2013
It is worth noting that this number is the amount used for grants and does not include internal costs associated with giving these grants. Breakthrough T1D reports its total research budget as a bigger number, totaling the actual grants, internal costs of giving these grants, and advocacy program expenditures. General accepted accounting rules require that both research grants and related costs be reported and visible, therefore including advocacy in the research total is a leadership choice.
In addition, the number we are reporting here does not include the amount of money that the T1D Fund has invested during the year in commercial entities, either in purchasing stock or in convertible loans. If that number is included, the amount of grants plus T1D Fund investments would reach 51% of revenue.
Last year, Breakthrough T1D leadership provided guidance via a phone discussion that research grant amounts would increase in FY23 by 40-45% versus FY22, and this was delivered as promised. We anticipated that the research grant number would just break $100 million, just a bit ahead of the actual $98 million.
The guidance for FY24 is that research grants will see “modest growth” and that there will be an “increased focus on cell therapies in FY24 and beyond.”
Payroll Costs: Up from Prior Year but Still Down from Pre-COVID Years
Several payroll cost reductions taken during the COVID years have been carried into FY23. Compared to 2019, payroll costs were 13% lower, a good thing, suggesting that Breakthrough T1D is operating with greater efficiency (see chart 4).
Chart 4: Expense Categories ($ Millions)
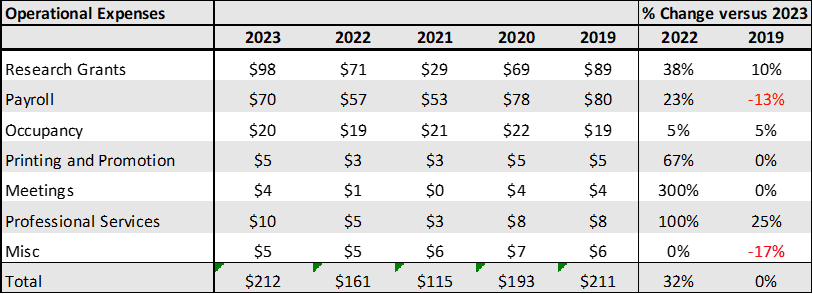
However, payroll costs have risen substantially in the last two years, up +23% versus FY22 and +32% versus FY21. In real dollars, payroll in FY23 was $70 million, up +$13 million from FY22 and +$17 million from FY21—large enough numbers to fund new jobs and salary increases.
Breakthrough T1D is at risk of losing the efficiency it gained during COVID if payroll continues to increase unchecked. Keeping it will require board and executive discipline to resist the natural tendency of any large bureaucracy to add staff. If the efficient payroll cost structure can be maintained then the money can be reinvested into other mission-based purposes, such as cure research grants, which would be of great benefit to the T1D community.
A Huge Stockpile of Cash and Short-Term Investments
The final key point related to expenses is that Breakthrough T1D has built up a massive war chest of cash and short-term operating investments. In FY23, $188 million was placed in short-term investments compared to $18 million in FY19, a +944% increase (see chart 5).
Chart 5: Cash and Investments ($ Millions)
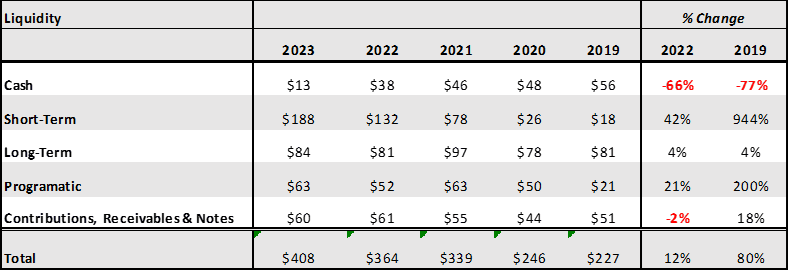
A sizable portion of short-term investments (approximately $100 million) are held by the T1D Fund, and the remaining $88 million is held by the Breakthrough T1D parent organization. According to Breakthrough T1D leaders, the fund is expected “to deploy $25-30 million annually, but the exact amount is dependent on the market conditions and deal flow opportunities.” The large reserve held by the Breakthrough T1D parent organization versus pre-COVID years reflects a board of directors operating reserve policy implemented post-COVID to ensure appropriate levels of liquidity are maintained as the organization continues to grow and to “serve as a backstop to weather any significant business interruption.”
All said, $188 million is a lot of money that could do a lot of good today. Why not use a portion of that war chest to double down on Functional Cure research for T1D?
Endnotes
1. JDRF INTERNATIONAL and KPMG LLP, “JDRF INTERNATIONAL Consolidated Financial Statements June 30, 2023 and 2022 (With Independent Auditors’ Report Thereon),” Breakthrough T1D, URL: https://www.breakthrought1d.org/wpcontent/uploads/2024/05/JDRF-Audited-Financial-Statements-FY23.pdf.
2. JDRF, “Fiscal Year 2023 Annual Report: T1D Breakthroughs: Past, Present, and Future,” Breakthrough T1D, URL: https://www.breakthrought1d.org/wp-content/uploads/2024/05/FY23-Annual-Report-FINAL.pdf.